

February 28, 2023 – The growth of data has been on banks’ and FIs’ radars for some time. More financial services providers than ever are using external data to enrich what they collect internally. As data-driven insights find their applications in numerous areas of the financial services industry, improving the quality and quantity of these insights has become top of mind for IT leadership. This is where selecting the right data visualization tools comes into play.
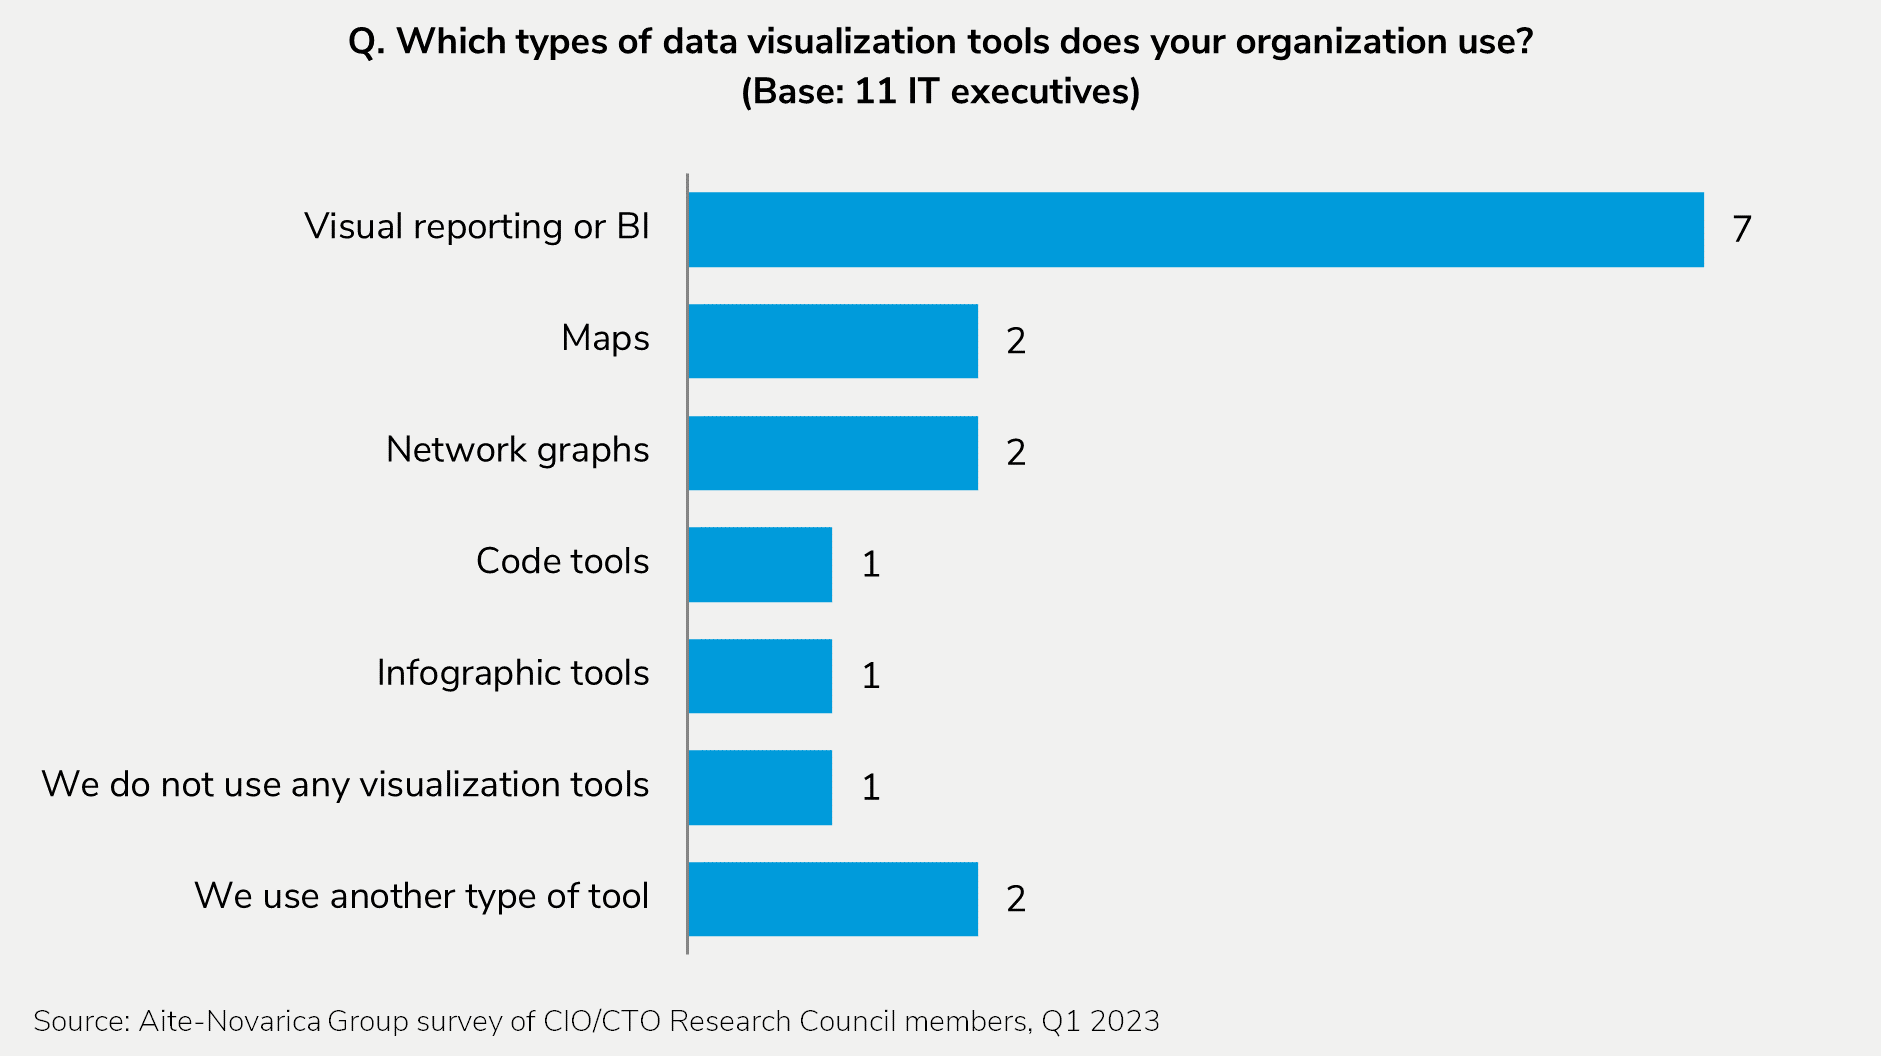
This report breaks down commonly used solutions and key considerations for IT leaders evaluating the best options for their banks and FIs. It is based on Aite-Novarica Group’s research from 2021 to 2023 and external articles on the topic; findings from Aite-Novarica Group’s Q1 2023 Research Council survey on data visualization tools are also included.
Clients of Aite-Novarica Group’s Community Banking service can download this report.
This report mentions Adaptive Planning, ChartBlocks, Cluvio, Datawrapper, Domo, Dundas BI, FusionCharts, Google, Highcharts, IBM, Looker, Microsoft, Qlik, Salesforce, SAS, Sisense, Spotfire, Tableau, TeamMate, Visually, Yellowfin, and Whatagraph.
About the Author